A dry blend that looks uniform does not prove that every bag has the same composition. Homogeneity verification requires a measurable marker, a representative sampling plan and one consistent analytical method. The coefficient of variation (CV) expresses the spread among samples relative to their mean. The number alone is not mixer performance, because sampling and laboratory error also affect it.
Define what will be measured first
The marker should be a formulation component that can be measured reliably by the chosen method. Salt, pigment, mineral additive or another component may be used, but the analytical method must suit the product matrix. Target value, method, sample mass and preparation step are documented before the trial. CV must not be read alone when the mean misses the target: all samples can be biased in the same direction while CV remains low.
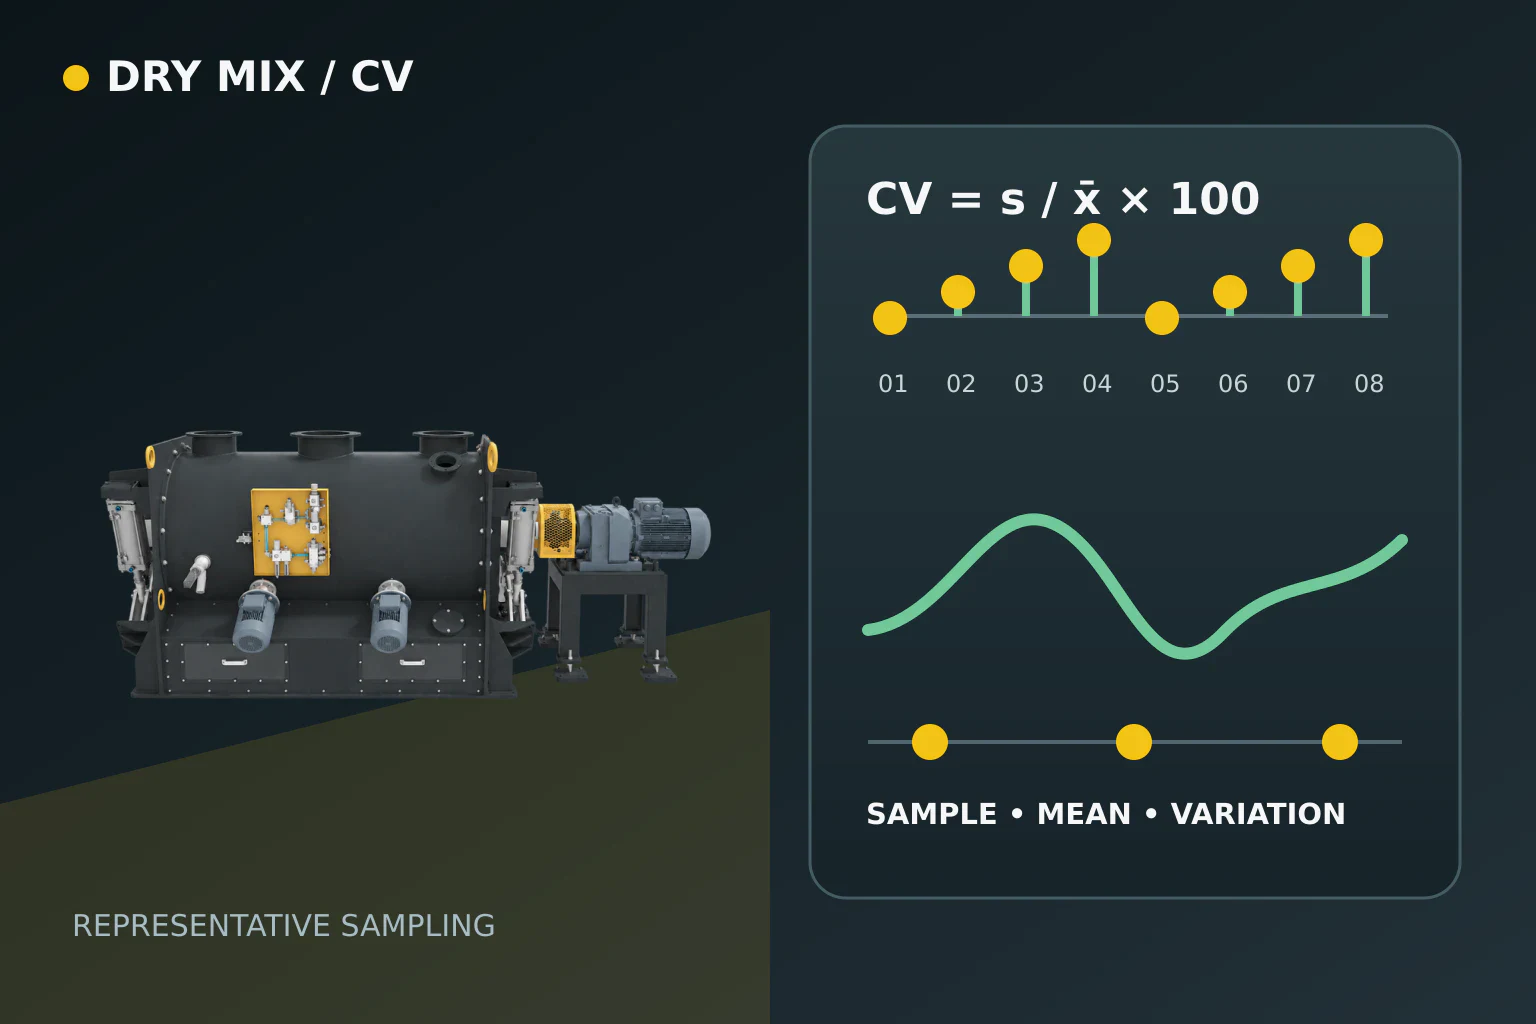
Consecutive samples from one point do not represent the whole blend. During discharge, collect from the beginning, middle and end and, where possible, from different parts of the flowing stream. Use the same sample mass and container and record timestamps. An eight-point plan is not a universal requirement; the count must be justified by batch size, risk and method sensitivity.
The sampling device can also change the result. A thief inserted into a powder bed may preferentially collect fine or free-flowing particles or disturb the bed. Probe geometry, insertion direction, filling behaviour and discharge-stream sampling should therefore be compared under one procedure. Even with a good blend, a biased tool can create an artificially good or poor distribution.
Read CV together with the mean
First calculate the arithmetic mean x̄ and sample standard deviation s. Then use CV = s / x̄ × 100. CV is a unitless percentage that helps compare trials on the same scale. The ratio becomes unstable when the mean is near zero, and measurement uncertainty must be considered before directly comparing different markers or analytical methods.
In a hypothetical recipe, assume a marker target of 2.00 percent. If eight results are 1.96, 2.02, 1.98, 2.04, 1.99, 2.01, 1.97 and 2.03 percent, the mean is 2.00 percent, the sample standard deviation is about 0.029 percentage points and CV is about 1.47 percent. This only demonstrates the calculation; it is not a measured Metkan-mixer value, universal limit or performance guarantee.
| Metric | Hypothetical calculation | Interpretation |
|---|---|---|
| Sample results | eight values from 1.96 to 2.04 percent | raw values are retained with location and time |
| Mean x̄ | mean of eight results is 2.00 percent | assessed together with the 2.00 percent target |
| Sample standard deviation s | about 0.029 percentage points | shows absolute spread among samples |
| Coefficient of variation CV | 0.029 / 2.00 × 100 gives about 1.47 percent | not a universal acceptance limit |
The site must define acceptance criteria using the product specification, marker dose, analytical uncertainty, sample count and application risk. Copying a CV limit from another sector or formulation is not technically defensible. The report should retain the mean, standard deviation, CV, raw values, sampling location and analytical method together.
Use separate trials to locate the source of variation
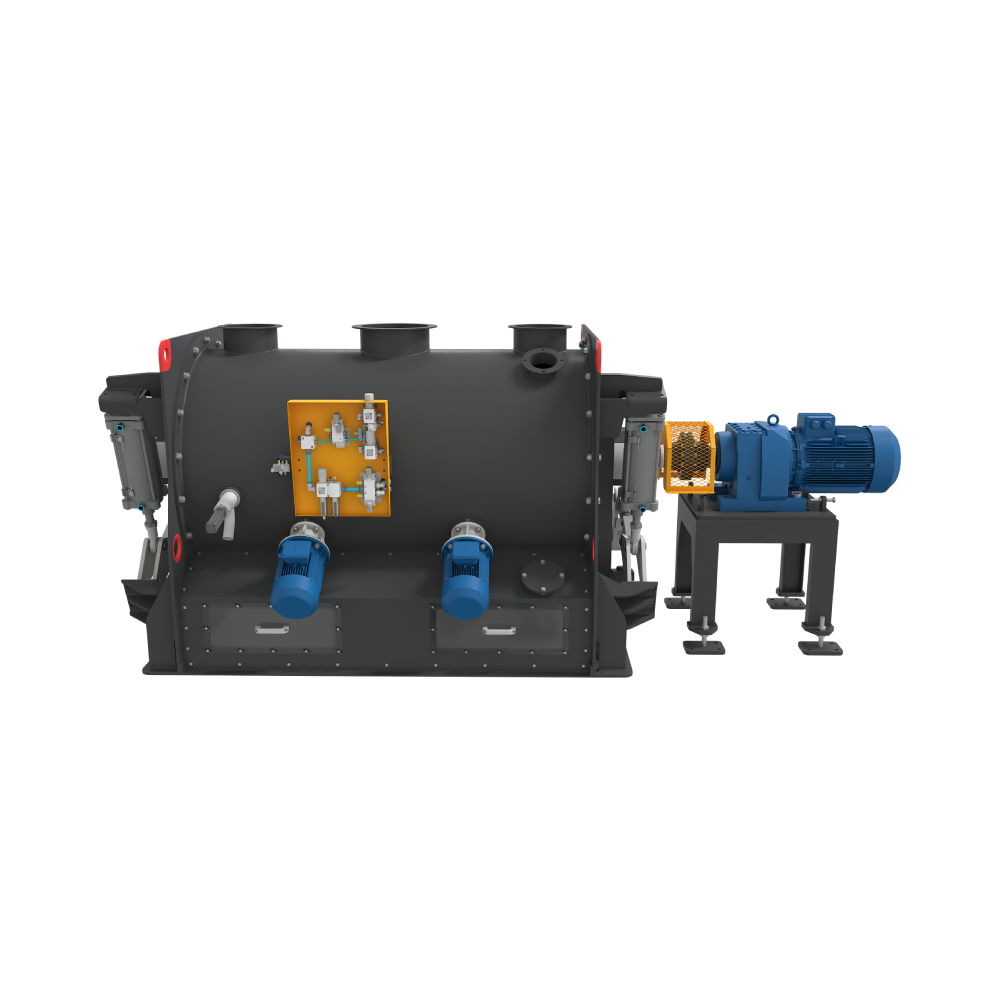
First analyse the same homogenised sample several times to estimate method repeatability. Then take independent samples at the same discharge moment. If analytical repeats vary while process samples agree, the measurement method may be the issue rather than the mixer. If repeats are stable but beginning and end samples differ systematically, investigate mixing, discharge or segregation.
To verify mixing time, run the same formulation at constant fill level for different durations and use the same sampling plan in every trial. The region where CV no longer falls meaningfully informs the process, but longer time should not automatically be considered better. In blends with large particle-size or density differences, prolonged mixing or subsequent transfer can increase renewed segregation.
If CV is acceptable at the mixer discharge but distribution worsens in bags, the investigation must continue downstream. Free-fall height, hopper geometry, screw or pneumatic conveying and residence time can change segregation. Comparing mixer discharge, post-transfer and packaging points with the same marker makes the equipment interval where the loss appears easier to identify.
What data are needed for mixer assessment?
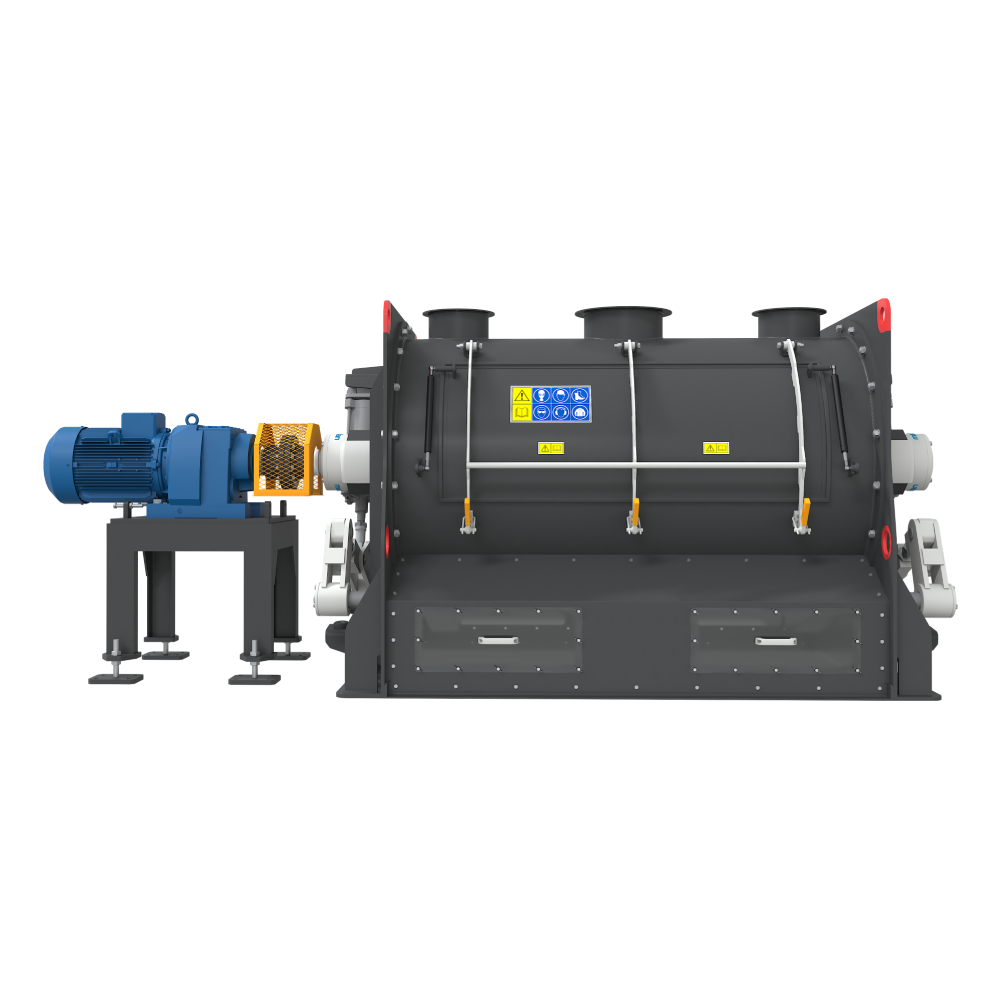
For assessment of a mixer or dry-mix line, provide formulation ratios, bulk densities, particle-size distributions, batch mass, fill level, charging order, mixing time, discharge method and raw analytical results. When the Metkan horizontal powder mixer and building-chemicals line are reviewed together, sampling points can be planned from dosing through packaging, not only at mixing. The product, plant and contact links below help define the technical scope.
Sources and method limits
Sources checked on 29 October 2026. ISO and FDA pages support representative-sampling principles; the FDA source is a stricter pharmaceutical context and does not set acceptance limits for building chemicals. NIST supports the CV definition. The peer-reviewed study shows that sampling technique can bias the result. Standards are not reproduced.