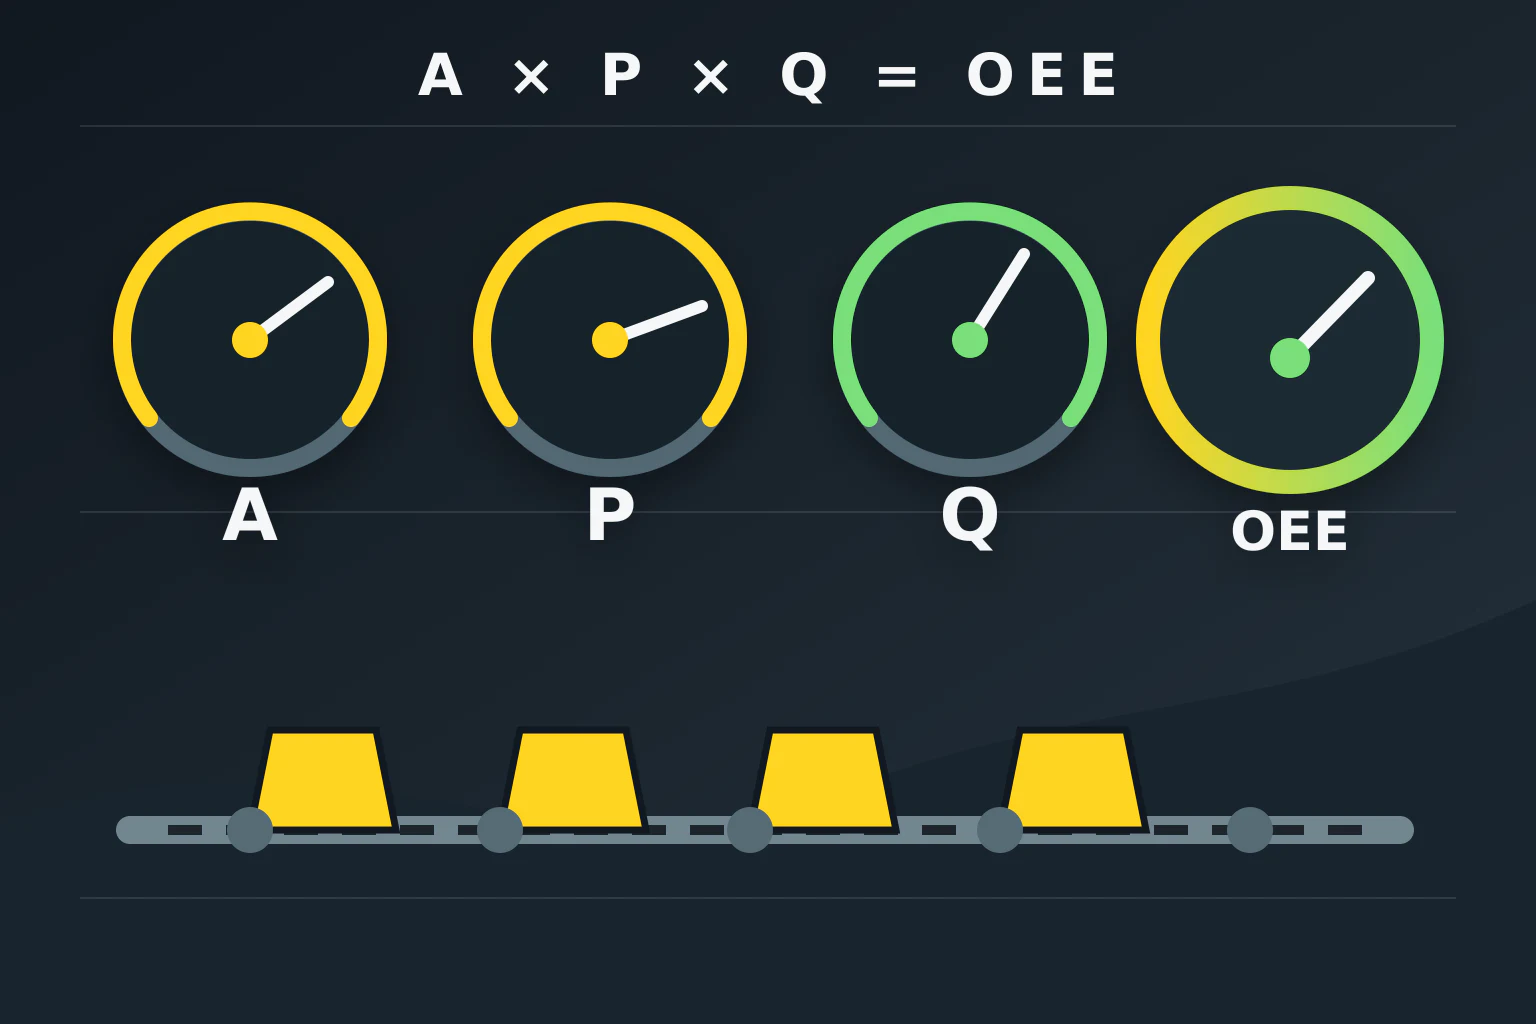
A packaging line may appear to run throughout a shift, yet waiting, minor stops, reduced speed and rejected bags are different losses. OEE shows how much planned production time becomes good output at the target rate. This guide explains how to define the line boundary, calculate the three factors and interpret the result with automation data.
Define the measurement boundary and time first
OEE can be calculated for one machine, a cell or an entire line, but numerator and denominator must use the same boundary. If the packaging line includes filler, discharge conveyor, checkweigher and palletising, the line is not running when any required element stops the flow. Measuring only robot cycle time and presenting it as line OEE hides where losses occur.
Planned production time is the period allocated to production. Breaks or other scheduled activities excluded by the production plan must be defined explicitly in the site’s data rules. Runtime remains after losses that actually stop the line are deducted. If shifts use different definitions, OEE comparisons lose meaning, so stop codes must be agreed before calculation begins.
OEE combines three factors
Availability A equals runtime divided by planned production time. Filler faults, waiting for bag supply or a full line stop during pallet change reduce this factor. The rule deciding which events are planned and which are production losses must be fixed in advance. Excluding breakdown time in one shift and including it in another makes the result incomparable.
Performance or effectiveness P equals ideal cycle time multiplied by total count, divided by runtime. Running below target and minor stops not represented as downtime appear in this factor. Ideal cycle time need not be a catalogue maximum; it should be a sustainable reference for the same product, bag and approved operating condition. If set unrealistically short, performance can exceed 100%, signalling that the data rule needs review.
Quality ratio Q equals good count divided by total count. Underweight or overweight bags, improperly closed packages and units requiring rework are classified according to the site’s approved quality definition. Counting a reworked bag as first-pass good output hides the quality loss. The criterion must be recorded together with the product specification and inspection method.
A worked shift example
Assume a shift with 450 minutes of planned production time and 405 minutes of runtime after stops. Let ideal cycle be 0.10 min/bag, total output 3645 bags and good output 3572 bags. A = 405 / 450 = 90.0%; P = 0.10 × 3645 / 405 = 90.0%; Q = 3572 / 3645 ≈ 98.0%. OEE = A × P × Q ≈ 79.4%. This hypothetical example is neither a measured Metkan-line result nor a target.
| Factor | Calculation | Calculated result |
|---|---|---|
| Availability A | 405 / 450 shift minutes | 90.0 percent |
| Performance P | 0.10 min/bag × 3645 bags / 405 min | 90.0 percent |
| Quality Q | 3572 good bags / 3645 total bags | approximately 98.0 percent |
| OEE | A × P × Q | approximately 79.4 percent |
| Fully productive time | 3572 good bags × 0.10 min/bag | 357.2 minutes |
Do not interpret the result as a score by itself. Availability and performance are equal in the example, but their lost time differs. A 10% availability loss equals 45 minutes of planned time. Performance loss represents slow running and minor stops during runtime, while quality loss is 73 bags. Improvement priority comes from examining time, quantity and cause records for all three losses.
Connect PLC and HMI data to events
Automatic logging needs at least planned start and finish, line-ready status, run signal, stop start and end, product recipe, total count and good count. If operators select stop reasons, the list should be short and mutually exclusive. A sensor signal alone does not guarantee correct classification: a conveyor motor may run while no bag passes because the filler is waiting.
The minor-stop threshold must also remain fixed. If a five-second stop is assigned to performance in one shift and availability in another, the trend is false. Pallet change, product change, bag supply, weight reject and robot waiting may have separate codes, but the list must not become too large for reliable selection. Retaining raw events allows the classification rule to be audited later.
Turn OEE into a proposal and improvement input
Do not compare OEE across products, bag sizes or shift rules without context. Establish a stable baseline for the same recipe and package, then examine the largest loss family and dominant event codes. Low availability may point to maintenance or supply continuity; low performance to cycle coordination and minor stops; low quality to filling and package control. This does not automatically mean that a particular machine must be replaced.
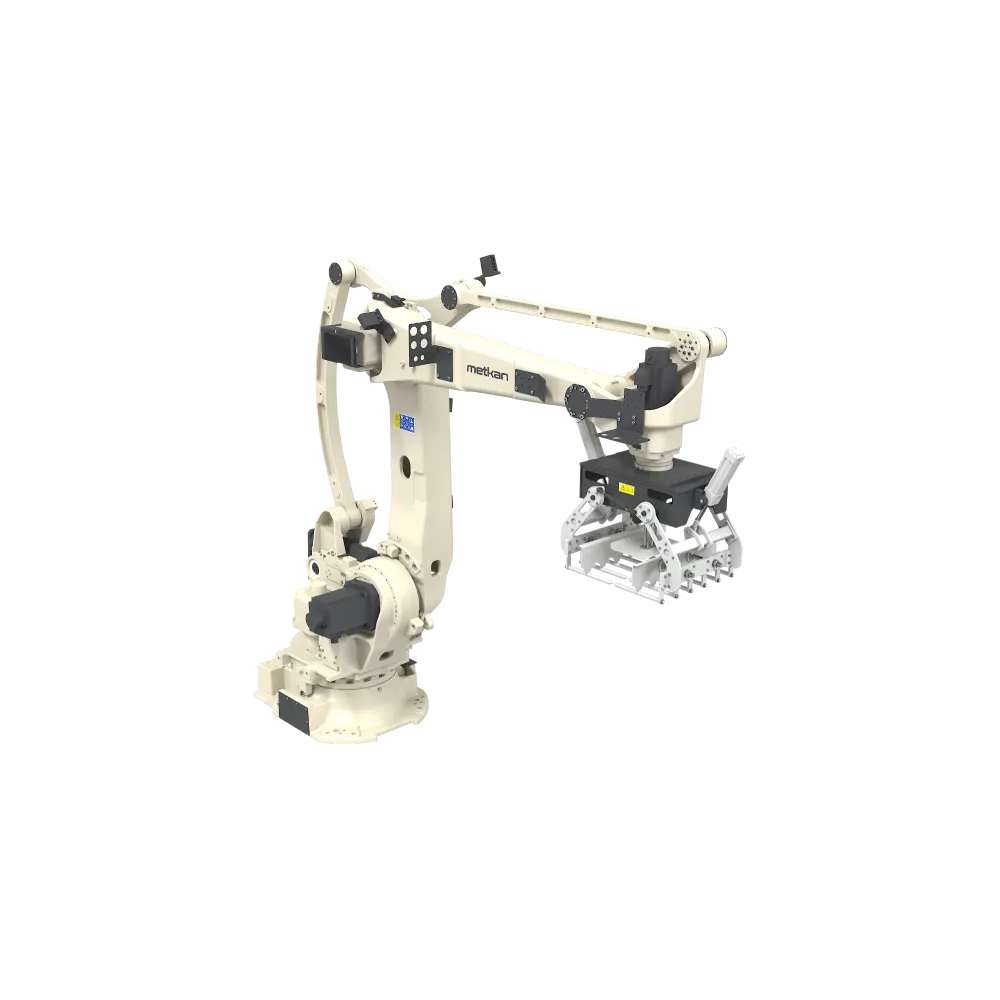
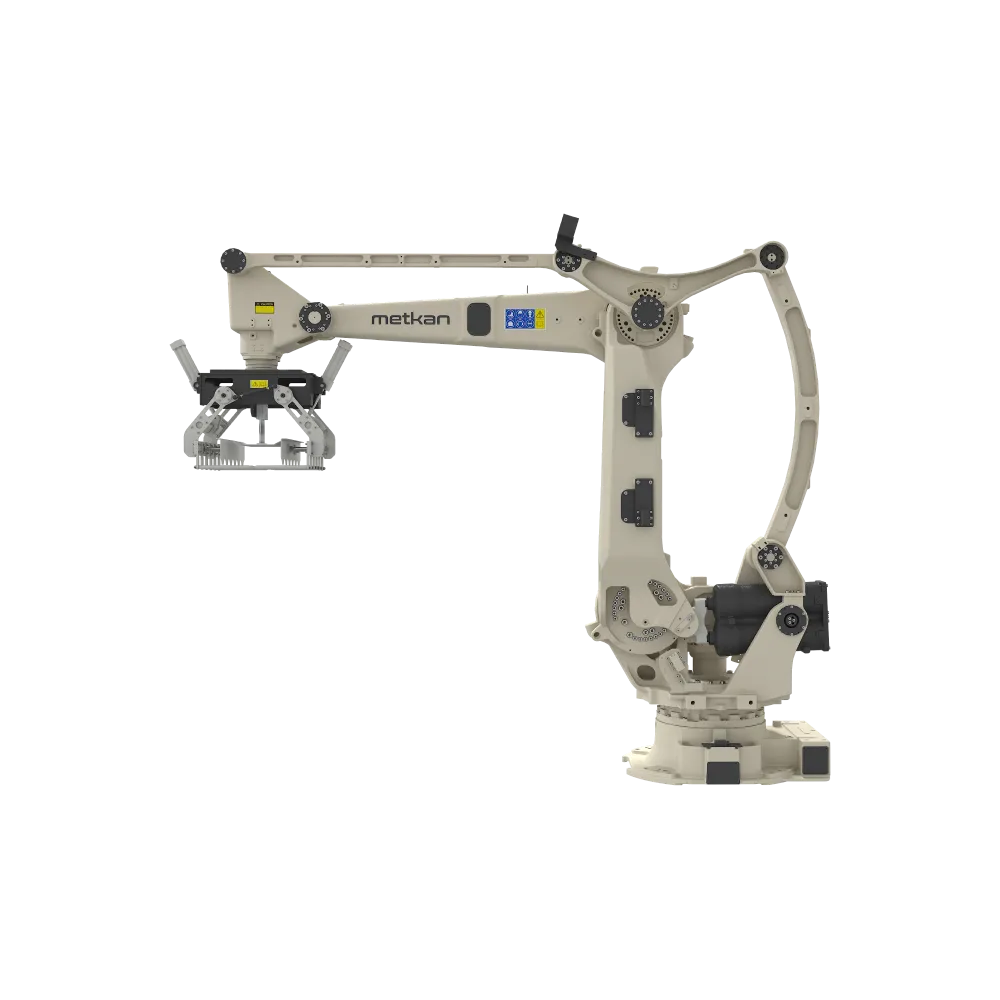
When reviewing a packaging and palletising line with Metkan, provide product and bag details, approved ideal cycle, shift plan, stop records and good/reject counts. These can be assessed with PLC signals, HMI event codes and the mechanical line boundary. The automation, robotic palletising and contact pages below help define the scope. The cover is an illustrative technical diagram, not a customer site or measured performance. Machines shown in the article are Metkan product renderings.
Sources and measurement limits
Sources checked on 27 October 2026. ISO 22400-2:2014 is published but under revision; the edition used is stated explicitly. Official scope and the OEE relationship are summarized without reproducing the standard. The example is entirely hypothetical.