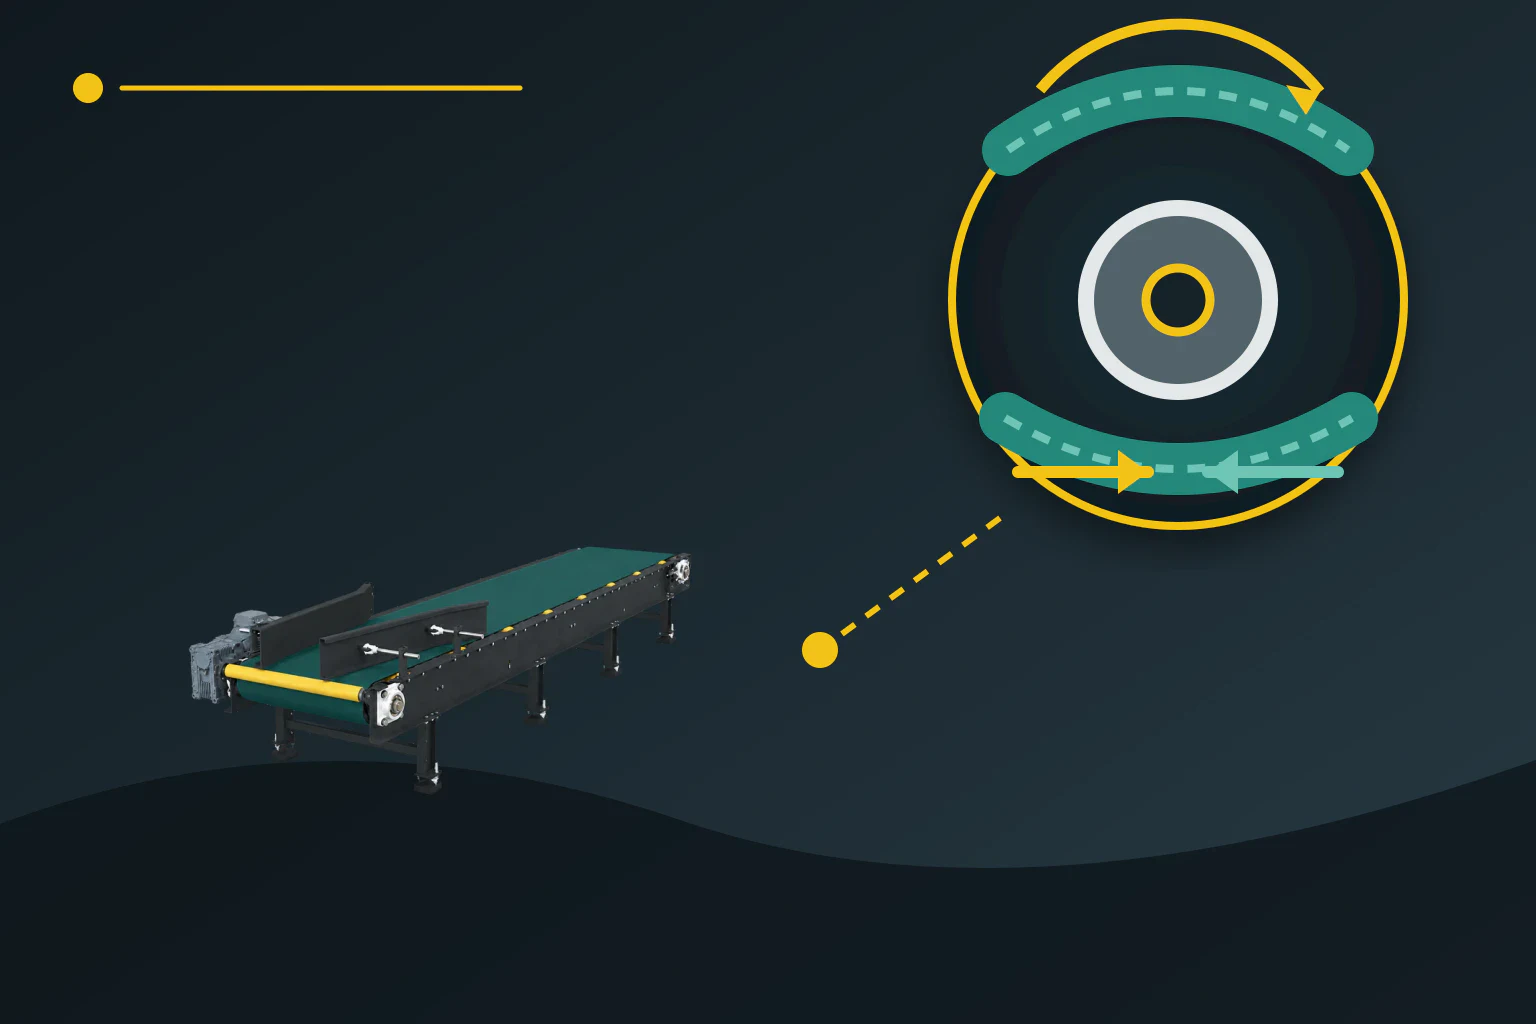
If belt speed falls or surges under load while the motor continues to run, the problem should not immediately be labelled insufficient motor power. The drive pulley may be rotating faster than the belt; low tension, a wet or dusty interface, worn lagging or a temporary overload can create the same symptom. A reliable diagnosis starts by comparing pulley peripheral speed with actual belt speed at the same time.
Confirm true slip with a speed ratio first
Pulley peripheral speed is calculated from measured rotational speed and effective diameter; belt speed is measured on an independent follower pulley or with a suitable non-contact sensor. For comparison, slip can be trended as s = (v_pulley − v_belt) / v_pulley × 100. If pulley speed is 1.50 m/s and belt speed is 1.44 m/s, the difference is 4%. This is an illustrative calculation, not an acceptance limit. Sensor resolution, effective pulley diameter and elastic belt stretch all affect the result.
A single speed switch often proves only that the belt is moving; it does not reveal a small but increasing difference between pulley and belt. Pulley speed, belt speed, motor current, feed rate and take-up position should share one timeline. Record start-up, steady no-load operation and steady loaded operation separately. This separates brief elastic creep at start-up from persistent slip under load and from mechanical speed loss upstream of the pulley.
Check the four groups that govern traction
Transfer of peripheral force from pulley to belt depends on tight- and slack-side tension, wrap angle, friction at the interface and the required drive force. ISO 5048 provides the calculation framework for drive-pulley power and belt tensile forces and was reconfirmed as current in 2026. Calculations do not replace maintenance diagnosis: if the take-up is jammed, lagging is polished or fines cover the interface, traction that was adequate in design may be inadequate in service.
Inspect free movement of a gravity take-up, available travel of screw or hydraulic take-up, the lagging surface and wrap geometry. Excessive tension can be as harmful to bearings, splices and belt life as insufficient tension, so increasing tension alone is not a sound cure. Identify the source of oil, water or fines; assess surface cleanliness and lagging condition within the plant’s authorised shutdown and energy-isolation procedure.
Match the symptom with measured evidence
The sequence below does not turn one value into a definitive fault; it shows which check comes first. Slip only during start-up directs attention to acceleration time, feed sequence and drive control. A speed ratio that diverges steadily with load points to required peripheral force versus available traction. If pulley and belt slow together, investigate the motor, gearbox, coupling or electrical supply rather than the contact interface.
| Observation | Priority check | Verification |
|---|---|---|
| Pulley speed steady, belt speed falls with load | Take-up, wrap, lagging and contamination | Synchronous speed trends and mechanical inspection |
| Slip only during start-up | Acceleration ramp, feed sequence, initial tension | Repeat empty/loaded starts and capture maximum difference |
| Pulley and belt slow together | Motor, gearbox, coupling and electrical supply | Input/output speed, current and torque limit |
| Heat, odour or polished lagging | Persistent slip and contact surface | Surface and lagging inspection after energy isolation |
Verify the correction under the same condition
Research shows that belt–pulley friction varies with surface condition, lagging, tension and wrap, and that a laboratory coefficient may not represent field operation by itself. After correction, repeat the test with the same material, feed rate, acceleration ramp and sensor locations. Pulley-to-belt speed difference, motor current and take-up position should all move toward the reference; reduced noise or odour alone is not sufficient confirmation.
For a durable record, store the normal operating ratio, maximum start-up difference, material and moisture condition, and the intervention in the maintenance log. A ratio that slowly diverges over subsequent weeks may warn of lagging wear, loss of take-up travel or contamination. Keeping pulley speed and independent belt speed as separate PLC/HMI tags prevents maintenance teams from confusing slip with capacity loss or motor trouble and provides real operating evidence for later assessment.
Technical sources
These sources support the tension, speed-difference and belt–pulley friction approach. They do not provide a slip threshold or field-performance claim for a specific Metkan conveyor.
- ISO 5048:1989 — Operating power and tensile forces for belt conveyors; reconfirmed in 2026
- Sensors 2020 — Identifying elastic slip through belt linear-speed measurement
- Machines 2023 — Laboratory verification of frictional force transmission at a drive drum
- Maintenance and Reliability 2021 — Measuring friction-drum drive parameters in industrial service
- OSHA — Guarding around conveyors, pulleys and nip points