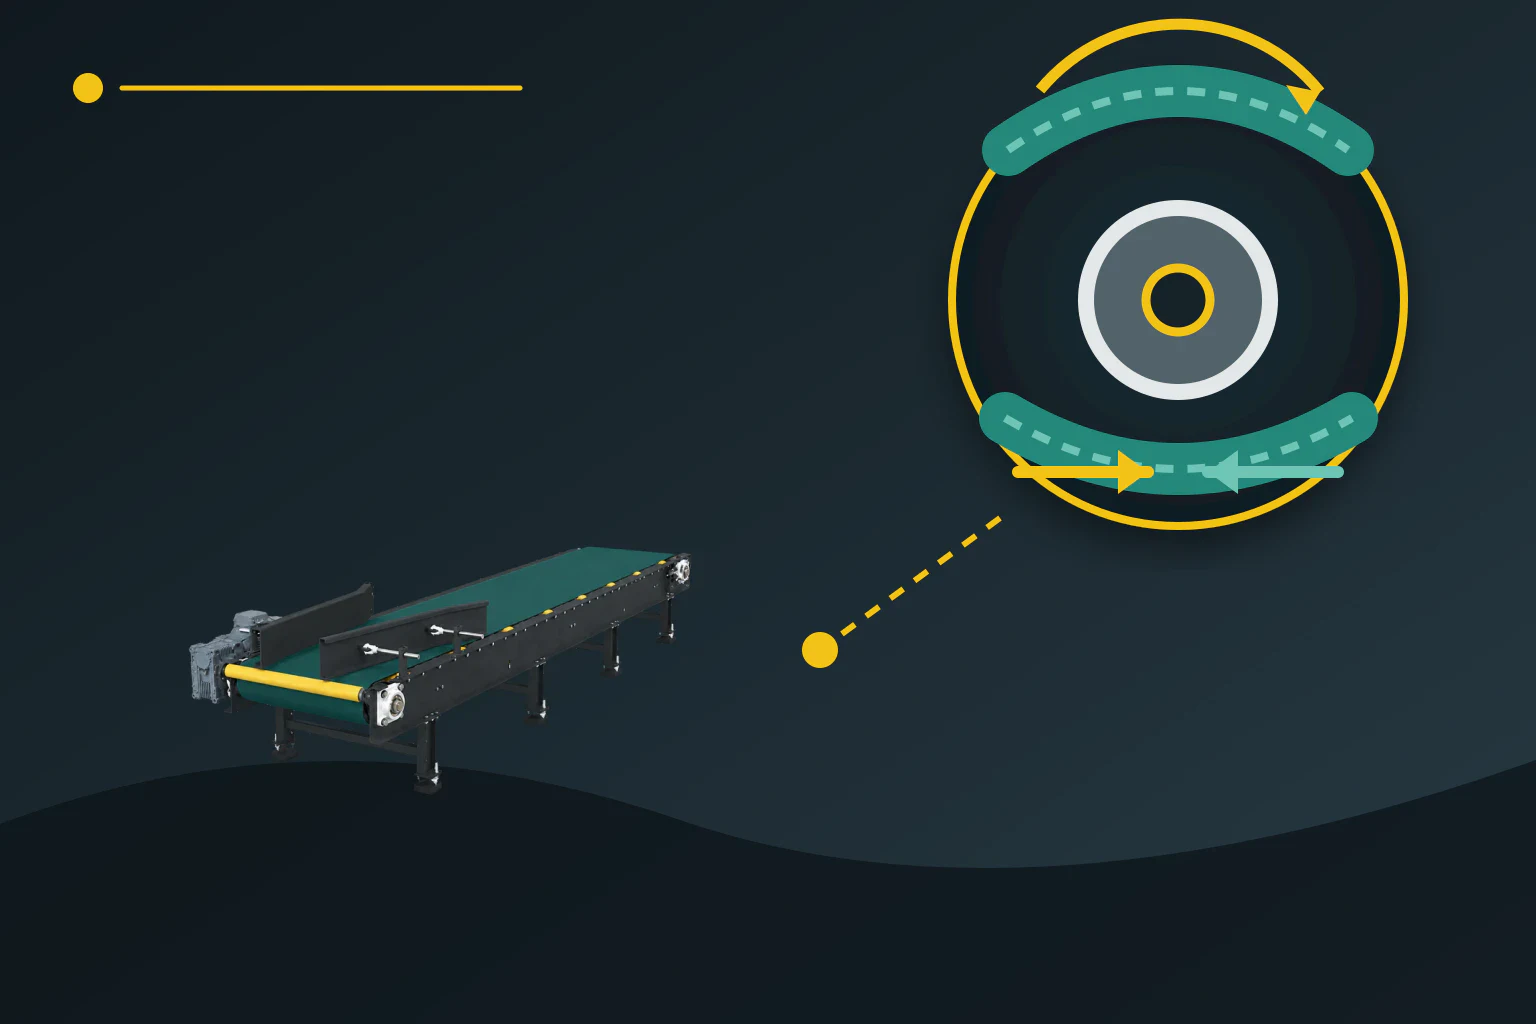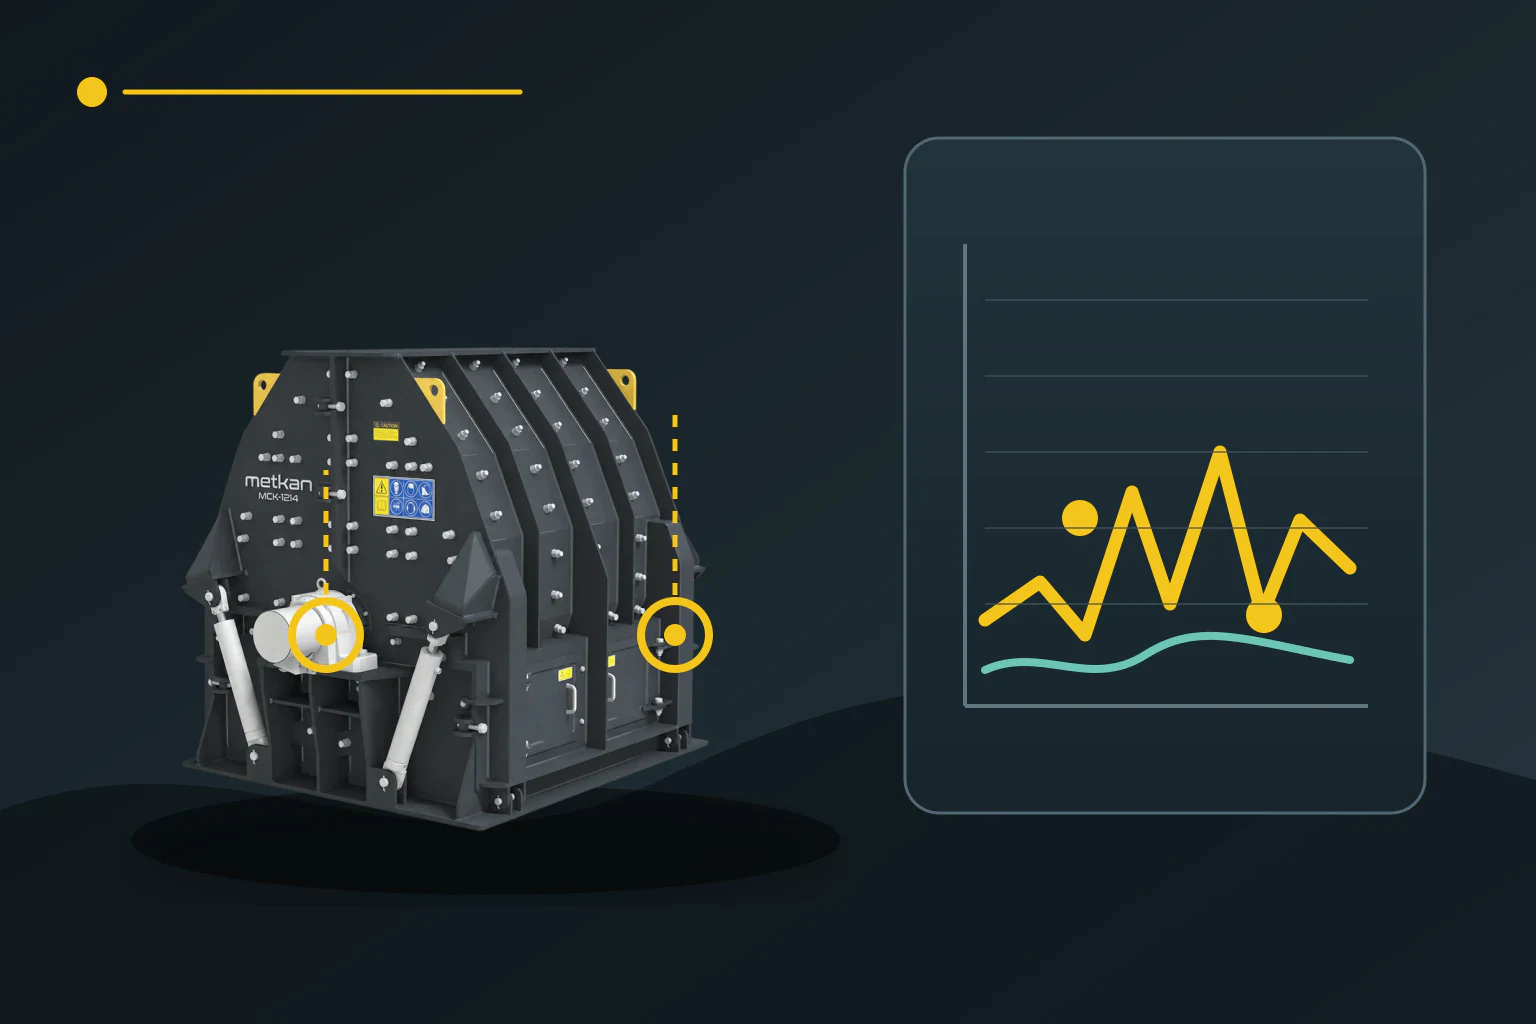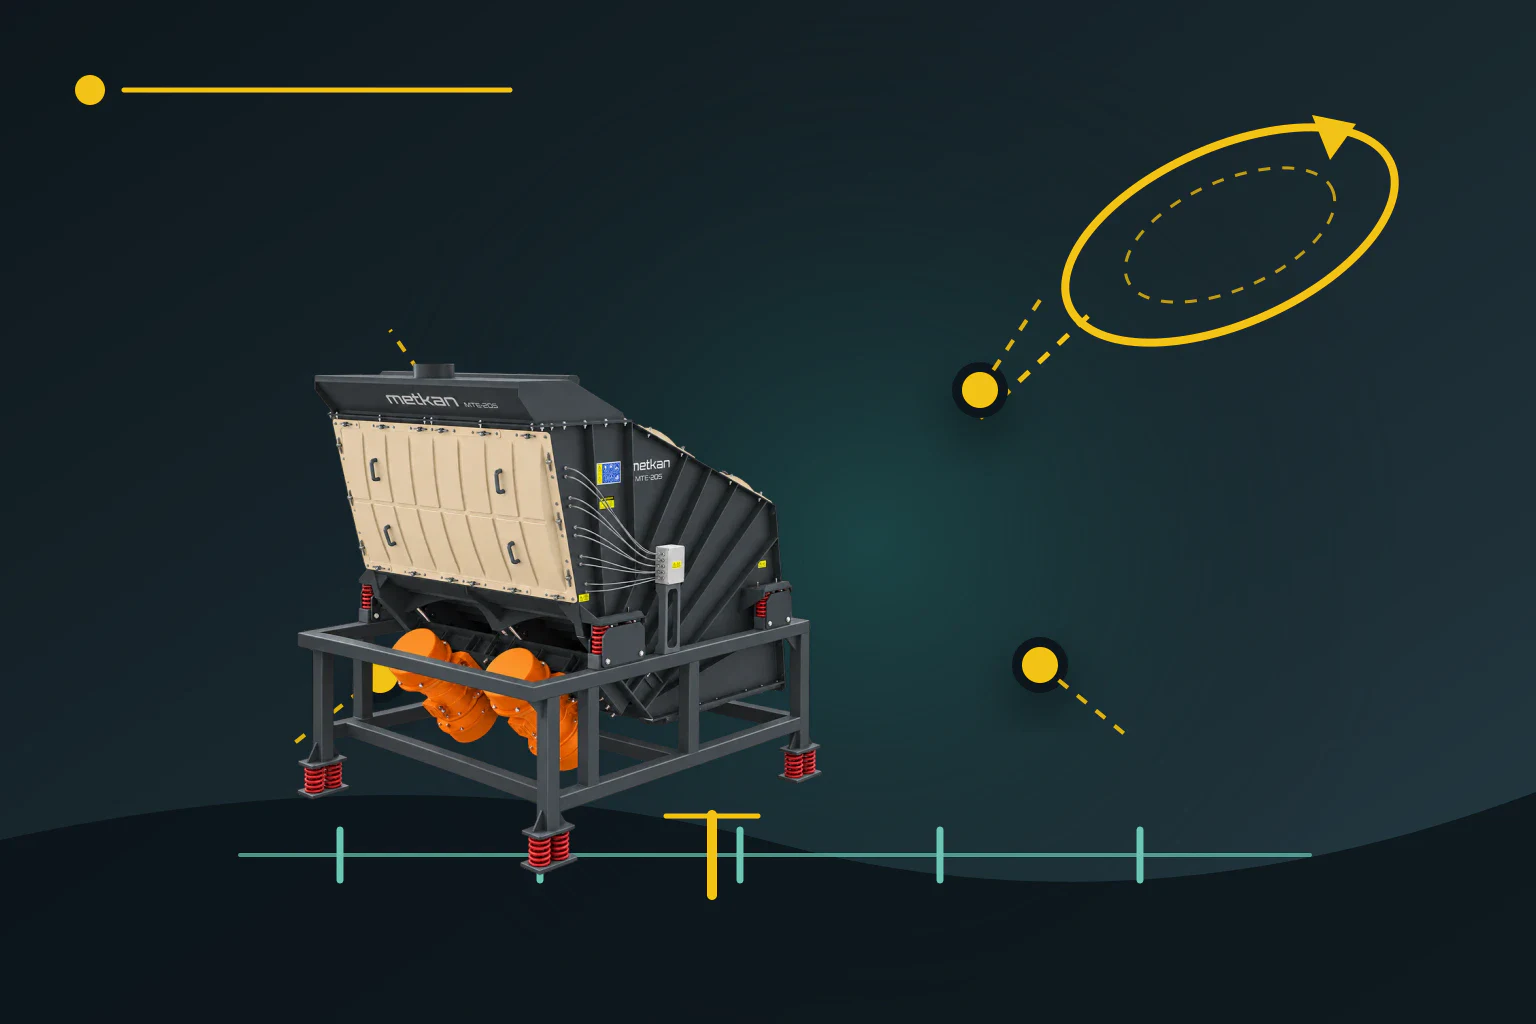
When the product distribution changes while screening calcite, quartz sand or dry-mortar raw material, the first suspicion is often that amplitude has fallen. Total stroke, one-way amplitude, frequency and motion direction are not the same quantity. Before changing an adjustment, screen-box motion must be measured at several points under the same load condition. This guide sets out that sequence and shows how to calculate the G-factor from rotational speed.
Do not treat stroke and amplitude as the same value
In ISO 1213-1 terminology, amplitude is the maximum displacement from the mean position, while stroke is the distance between the two extreme positions. For linear or elliptical motion, amplitude is half the total motion or half the major axis of the ellipse. A total stroke of 5 mm therefore means ±2.5 mm motion and 2.5 mm amplitude. Writing only “5 mm vibration” on a record can create a twofold interpretation error later.
For sinusoidal motion, the ratio of peak acceleration to gravity is approximately G = A × (2πf)² / g. A is one-way amplitude in metres and f is frequency in hertz, with f = revolutions per minute ÷ 60. For an illustrative total stroke of 5 mm at 1000 rpm, A = 0,0025 m and f = 16.67 Hz, giving about 2.8 G. This independent example is neither an acceptance limit nor a Metkan performance guarantee.
Measure four points under the same condition
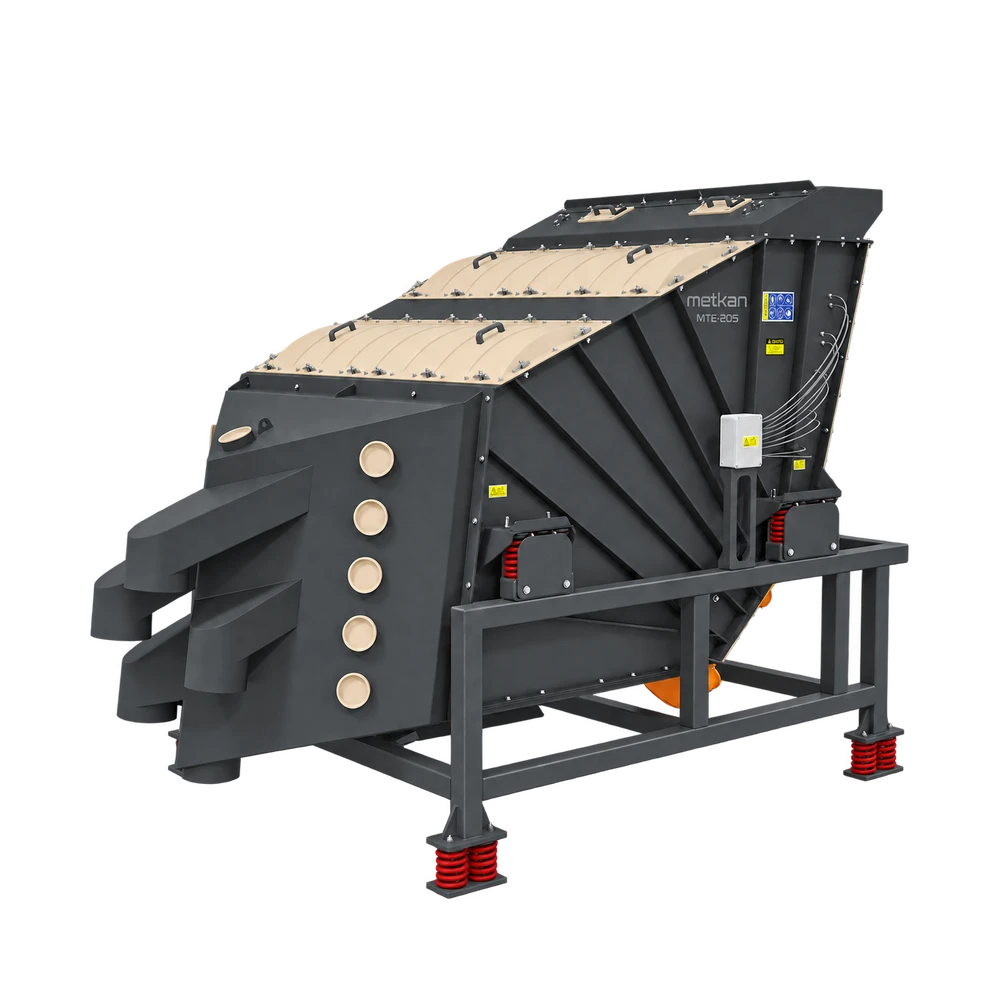
Define four points on rigid parts of the screen box: left and right at both feed and discharge ends. Sensor axes must retain the same orientation; a moving guard, motor cover or thin panel is not a valid point. Record steady no-load operation first, then steady loaded operation at the same feed rate. Logging speed, total stroke, motion direction, motor current and feed condition on one timeline helps separate a machine change from a load effect.
A stroke card or motion label gives a quick visual check: the optically intersecting marks indicate total movement and direction. A three-axis accelerometer is better for comparing frequency, acceleration and trajectory over time. Peer-reviewed studies on real and semi-industrial screens placed magnetically mounted or fixed accelerometers at strategic points. Attach the sensor only while the machine is stopped under the authorised energy-isolation procedure; do not approach a running screen to take a reading.
Interpret the pattern, not a single value
If left and right sides have similar frequency but different stroke, checking only the eccentric setting is insufficient. Spring stiffness or seating, a loose joint, material build-up, frame twist, or mismatched settings and rotation of paired motors can create the same pattern. Measurements that match when empty but diverge under load point toward crosswise feed distribution and bed depth. The table below prioritises checks; it does not turn one reading into a definitive fault.
| Observation | Priority check | Verification |
|---|---|---|
| Low stroke at all four points, frequency unchanged | Eccentric setting, vibrating mass and load | Repeat no-load/loaded tests and review settings |
| Different stroke on left and right | Springs, joints, build-up and frame | Compare amplitude and phase at four points |
| Stroke similar, frequency low | Motor speed, VFD output and supply | Tachometer and electrical trend |
| Sides match empty but diverge under load | Crosswise feed and bed depth | Check load distribution and four points at constant feed |
Change one variable and measure again
Do not change eccentric weights, springs or drive frequency at random. First confirm the manufacturer’s permitted range, matching eccentric settings and rotation directions on a twin-motor arrangement. Change one variable only, then repeat the four-point measurement at no load and at the same controlled load. An increase in stroke is not a successful adjustment if motion direction deteriorates, side-to-side difference grows or more vibration is transmitted to the supporting structure.
Record total stroke and amplitude in separate columns together with rotational speed and frequency. Add the four-point no-load and loaded results, sensor orientation, feed rate and material condition. This turns a later statement such as “vibration has decreased” into a measurable comparison. Share target size fractions, moisture, throughput and existing measurements with Metkan to assess the vibrating screen and automation scope together.
Sources and calculation note
The sources support the terminology, measurement method and motion components. The 2.8 G result is an explicit illustrative physics calculation, not a field measurement, universal setting or product guarantee.
- ISO 1213-1:2020 — Coal-preparation terminology; current published edition
- ISO/DIS 1213-1 — New draft that entered enquiry on 13 November 2026
- Measurement 2021 — Measuring vibrating-screen dynamic forces from acceleration at strategic points
- Sensors 2022 — Trajectory measurement with three-axis accelerometers on a semi-industrial screen
- Sensors 2021 — Condition-monitoring model of suspension vibration from a real mineral screen