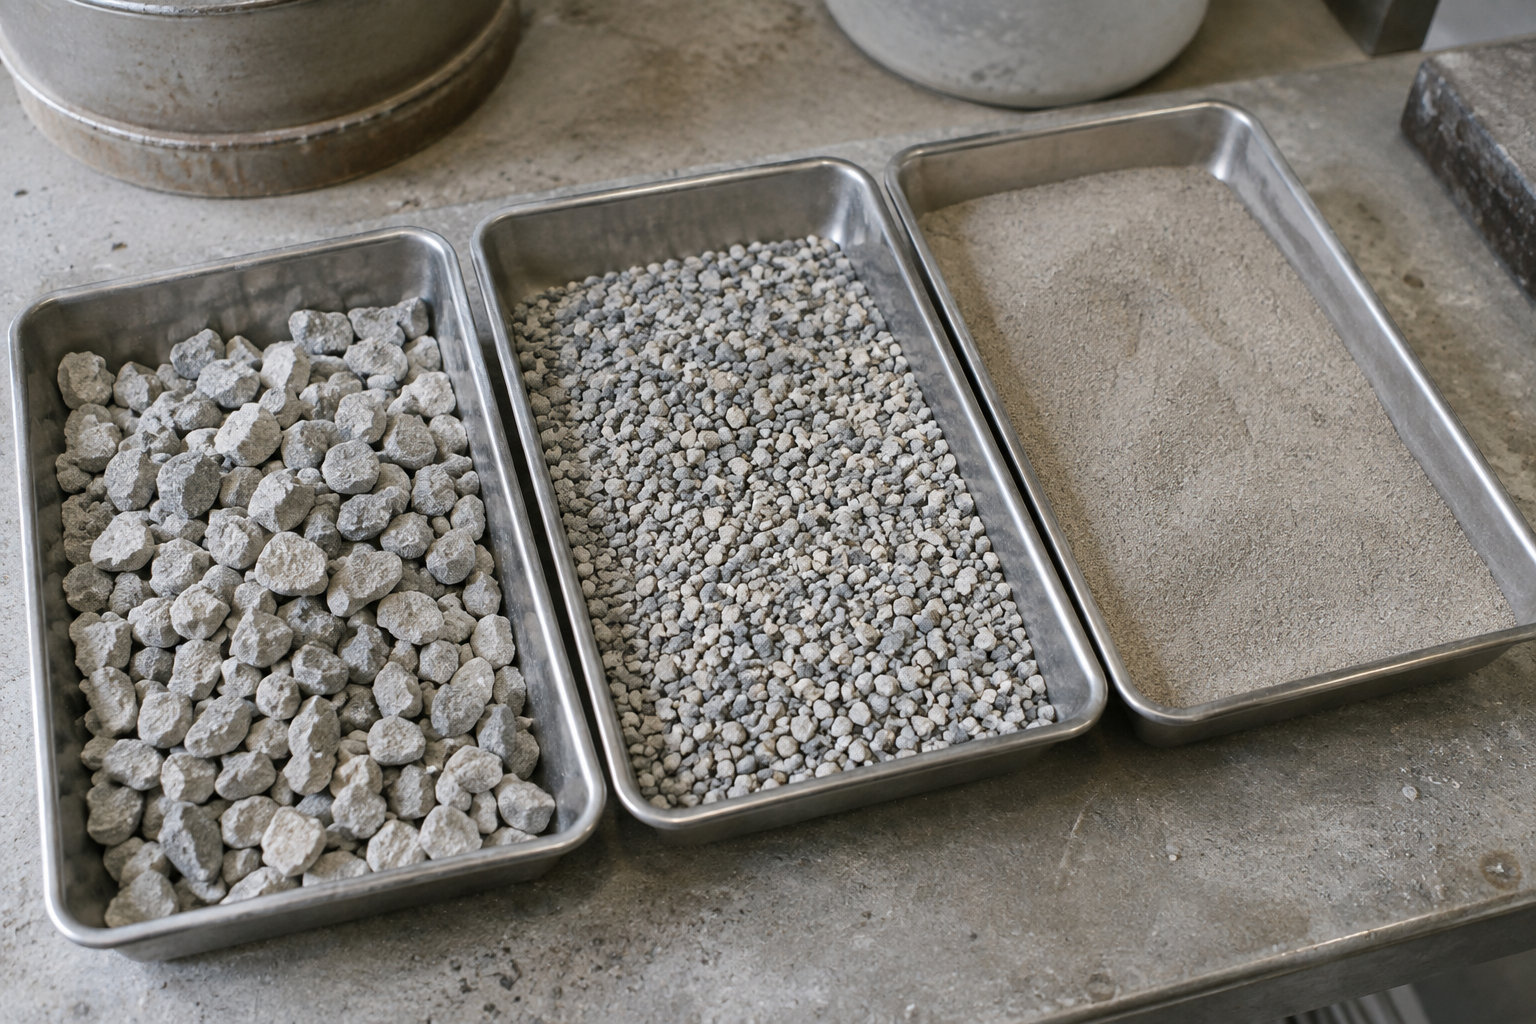
The tonnage passing through a vibrating screen does not, by itself, describe separation quality. In a calcite, quartz sand or dry mineral line, the key question is how much material below the target size reaches the correct outlet. Assess the feed, undersize and oversize streams against the same cut size. In this guide, efficiency means recovery of the fine material in the feed into the undersize stream. This separates throughput, product purity and separation performance into distinct measurements.
Define the cut size and acceptance criteria first
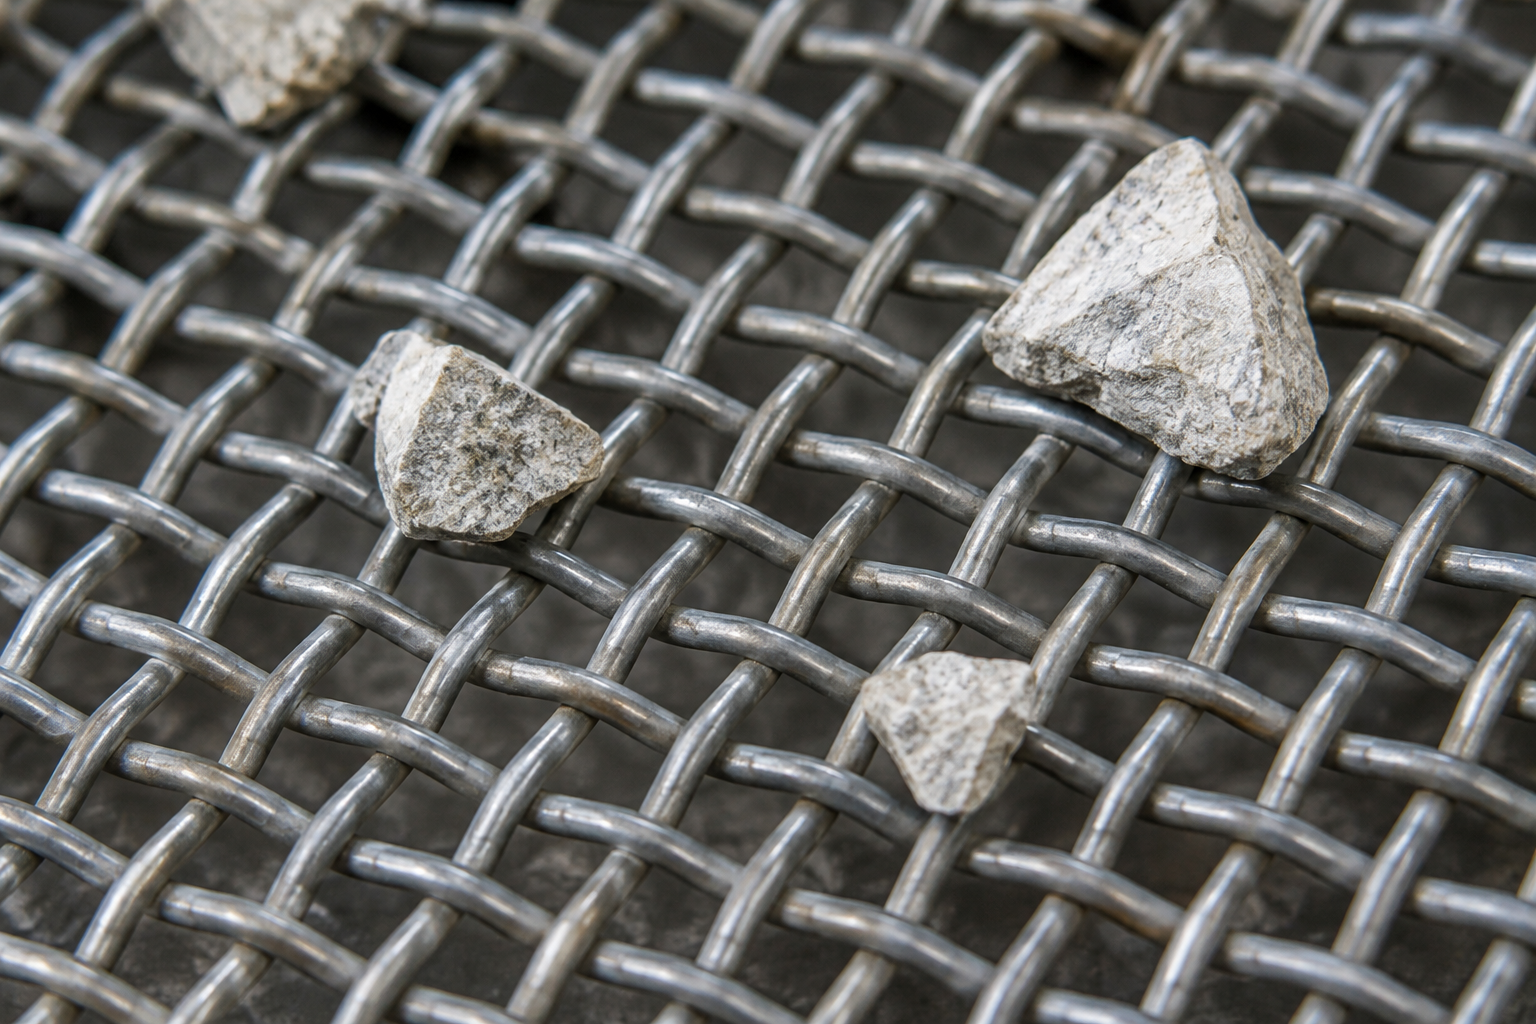
If a 1 mm test sieve is selected, measure the dry mass fraction below that size in every sample. The nominal aperture installed in the machine and its actual separation behaviour are different quantities. Particle shape, the proportion of near-size particles and operating conditions can affect the result. Evaluate each deck of a multi-deck fine screen using its own inlet and outlets; the total plant feed is not the feed to every deck. For a narrow product fraction, report material below its lower limit and above its upper limit separately.
Use comparable samples on a dry mass basis
Samples from the feed and both outlets must represent the same stable operating period. A handful taken only from the surface of a stockpile may not represent the entire stream. Agree the sampling plan with the quality team and record flow rate, moisture, aperture and operating settings. Determine each stream’s size distribution using the same laboratory method. Compare dry solids flow rates rather than combining wet tonnages from products with different moisture levels. Include dust extraction or any other side stream in the balance; do not treat an unmeasured stream as zero.
A University of Cape Town study assessed wet fine-screen products through size analysis and mass balances. The numbers below are an independent worked example, not results from that study.
Mass balance and the efficiency equation
Let F, U and O be the dry solids flow rates of feed, undersize and oversize. Let f, u and o be their mass fractions below the control size. Convert percentages into decimal fractions for calculation. At steady state, without accumulation or side streams, the total balance is F = U + O and the fines balance is F × f = U × u + O × o. These equations reveal whether the measurements are mutually consistent.
For fines recovery, screen efficiency is E = (U × u) / (F × f) × 100. Product purity is simply u × 100. The ratio U/F is the total mass fraction of feed reporting to undersize; it is not itself screen efficiency. This recovery equation cannot be used if the feed contains no material below the target size. A separate recovery measure may be defined for the coarse product. Always identify the definition used in the report.
Worked example: high purity does not mean complete recovery
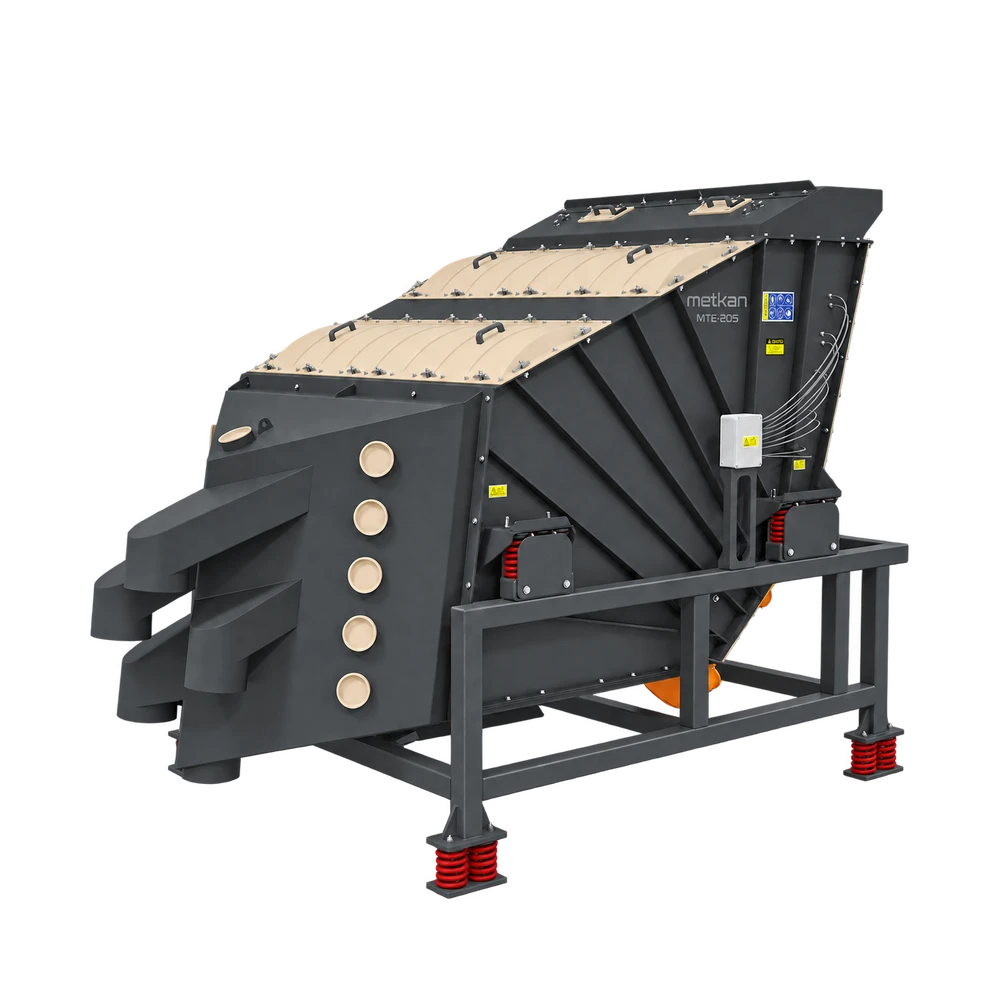
The following values are illustrative, not a capacity or performance commitment for a Metkan machine. Assume a control size of 1 mm, a feed rate of 50 t/h and a feed fines content of 60%. Let the undersize stream be 27 t/h with 98% fines. With no side stream, the oversize flow is 23 t/h.
| Stream | Dry solids flow (t/h) | Below 1 mm (%) | Amount below 1 mm (t/h) |
|---|---|---|---|
| Feed (F) | 50 | 60 | 30 |
| Undersize (U) | 27 | 98 | 26,46 |
| Oversize (O) | 23 | 15,39 | 3,54 |
The feed contains 50 × 0.60 = 30 t/h of fines; the undersize recovers 27 × 0.98 = 26.46 t/h. Efficiency is 26.46 / 30 × 100 = 88.2%. A purity of 98% alongside a recovery of 88.2% is not contradictory: 3.54 t/h of fines remain in the oversize. Its fines content is approximately 15.39%. This explains why looking only at an apparently clean undersize product is insufficient.
How do you turn the result into an operating decision?
If the balance does not close, check sampling, moisture correction and flow measurements first. If it is consistent, compare conditions associated with increased fines losses: are feed distribution across the deck, bed depth, blinding, mesh damage and near-size content comparable? Changing several settings at once obscures cause and effect. Change one variable in comparative trials, then repeat the product analysis. Obtain permissible vibration and mechanical settings from the equipment documentation; this calculation alone does not select a motor or amplitude.
Turan and Hacıfazlıoğlu’s fine quartz screening study also shows that moisture and screening surface affect the outcome. Its numerical efficiencies cannot be transferred directly to another machine, material or plant scale.
What belongs in the proposal and acceptance test?
For a screening project, specify each product’s grading limits, expected moisture range and sampling method alongside the target throughput. Report dry flow rate, target fraction purity and recovery for each deck together. Where material is recirculated, track its ratio to fresh feed separately. Acceptance criteria should not consist solely of catalogue capacity or one efficiency percentage. They must identify the material, operating conditions and measurement definition under which the result is achieved.
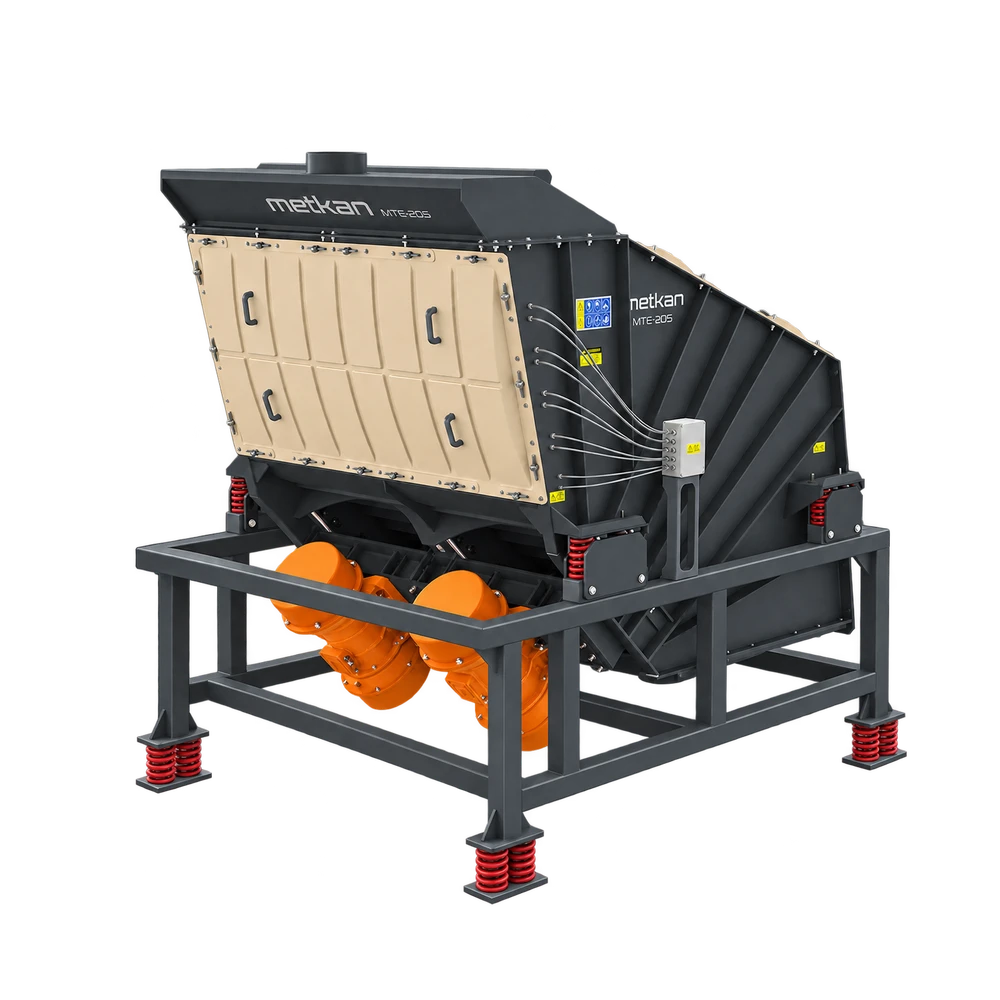
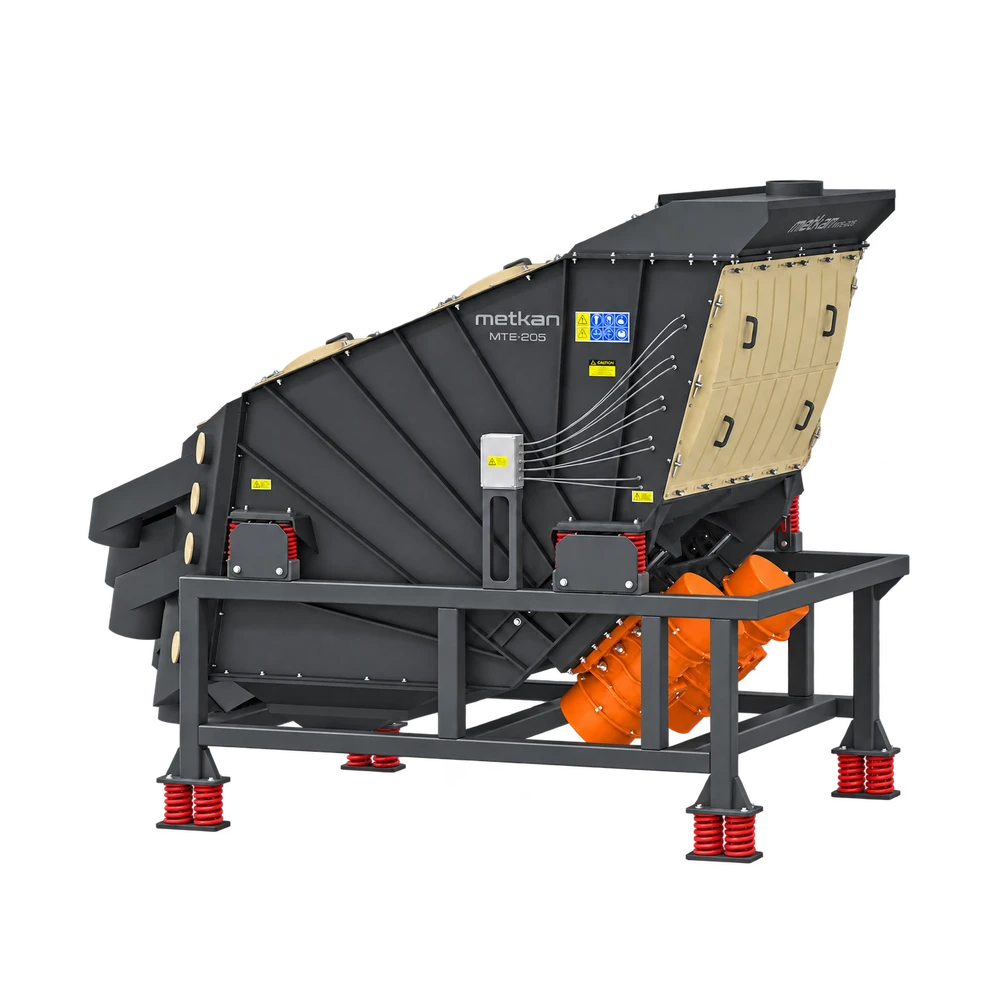
Share your feed analysis, target product fractions and existing layout with Metkan to define the screening scope. The product and plant pages below provide a starting point for assessing the equipment’s role in your process.
Sources and calculation note
The calculation is an independent example based on conservation of mass. Sources support the method and variable effects; they do not constitute customer testing or a product guarantee.